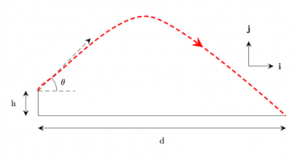
I’ve written before about the power of literate programming, using to create reports when code runs. It’s fairly simple to combine this with the graphical drawing packages to create impressive graphs and figures on the fly. A lot of academics I’ve spoken to have shied away from using
for drawing, despite being very proficient with the textual layout. Similarly, a lot of students on the OU Mathematics degree write up all of their assignments in
but drop in hand drawn graphs and diagrams. Just like anything else in
, once you get your head around how it works, it’s actually not that difficult to create very complex structures. Continue reading Diagrams with LaTeX – easier than you might think